Life Insurance for Seniors

Senior Life Insurance Infographic

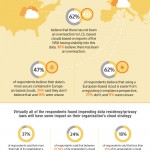
This infographic is designed to help seniors and their children with the purchase of final expense type life insurance. While this market is designed for amounts of coverage from $200- $40,000, the majority of cases are written on a whole life type policy that generates cash value.  However, cash value can never be taken out of the policy without the premiums increasing dramatically. Most people […] Read more »

Tour de France Stats and Facts

Tour de France Facts Infographic

With the 2014 Tour de France just around the corner, Eureka Cycle Sports have put together some interesting and fun facts from past tours, Including winners by nationality and the total number of winning cyclists from each country. France is currently in the lead with a total of 36 wins. The past 10 winners and their winning tour bikes have also been listed, including 2013 winner […] Read more »

New 2014 Perspecsys Cloud Trust Survey

Cloud Data Infographic

Perspecsys recently conducted a survey at InfoSec Europe 2014 in regards to the U.S. based clouds of more than 100 IT Security Pros. Interestingly over half of the European IT Security Professionals that were surveyed, don’t fully trust U.S. based clouds. Are these responses justified? Take a look below at the percentages and information on the infographic below and see for yourself. Cloud Trust graphic […] Read more »

Top Paying States for CNAs

CNA Salary infographic

The Affordable Healthcare Act allowed many Americans to obtain health insurance at an affordable price. This caused an increase in demand for healthcare services and most states quickly found that there was a shortage in healthcare personnel. Certified nurses assistants were one of the more popular career paths because there’s a low barrier to entry and it includes an average salary that could support a […] Read more »

Which Penny Skateboard is Right For You?

This infographic was created by a fan of the Penny Skateboards brand. Penny Skateboards is known for its high quality products as well as its fun designs that personify the brand’s personality. Penny is a fun brand who produce plastic boards that appeal to the youth culture as well as skaters of old. This infographic is designed to help you choose which style of Penny Skateboard […] Read more »

Understanding the Differences Between BLDC Motors and Brush DC Motors

BLDC Motor Components Infographic

BLDC motors are rising in popularity and as a result continue to be used more often in a variety of industries, from robotics to aeronautics. What makes them superior to other motors? The infographic below examines some of the key differences between BLDC motors and their main competition – brush DC motors. BLDC motors come in a variety of configurations, but the most widely used […] Read more »

The Four Types of Portable Air Conditioning

Types of Air Conditioning infographic

What with the weather the way it is having an explanation about the four different types of portable air conditioners and their pros and cons could be helpful. Mainly because this is something that often confuses customers. People often get mixed up between exhaust tubes and splits, and in name and operation. This infographic was created to be of use to anyone who is looking into […] Read more »

Responsive Website Design

Responsive Web Design Infographic

Responsive web design is growing bigger by the minute. As the market grows in ‘devices’ more and more people enter into multiple device terrain. Smartphones, tablets, laptops, PCs and smart watches are all part of this world, and in order for online business to adapt to this new world, online design is becoming more ‘responsive.’ Below are the 10 benefits behind responsive web design. What […] Read more »

Iconic Handbags Throughout History

History of Iconic Handbags Infographic

A single handbag can make a tiny, but significant dent in the history of humanity. One piece can be used to make a fashion statement and even align people’s lifestyles to protect the environment. How are these possible? Here are some examples: Glamour for a Cause Plastic bags from groceries and shopping sprees collectively lead to the waste of 10 billion bags each year. “I am Not a […] Read more »

How Stress Affects Your Work Performance

Stress Relieve Infographic

Stress seems to be a common factor in everyone’s life at some point. Stress is often related to the ever-growing number of stress factors and an incredible pace of life that many of us try to keep. It is almost inevitable that stressful situations in many ways affects your health and your ability to keep up your daily schedule. Unstable mood swings, irritability, and the inability to […] Read more »