Feel The Burn In 10 Minutes – Infographic

Feel The Burn In 10 Minutes - Infographic

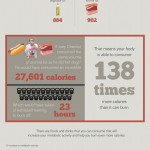
How many calories can we actually burn in 10 minutes? We can look at a few activities like running, sleeping, eating, driving, swimming, standing, etc.  Let’s look at this infographic to find out! This infographic is brought to you by QuickQuid. Here is how many calories we can burn in 10 minutes: Kettlebell training: 200 Swimming: 111 Standing: 16 Cleaning: 28 Cycling: 99 Using a […] Read more »

How to Take Advantage of Your Garage Space

Garage door space alternatives

As a homeowner, you may not be using your garage space to its fullest potential. This infographic, provided by GarageDoorRepair.com, describes how you can design your garage for alternative uses such as a gym, home office, sunroom, greenhouse, movie theater, playroom, yoga studio or apartment for lease. Courtesy of: GarageDoorRepair.com Here are some fun ideas of what you could transform your garage into: Apartment for […] Read more »

Mum’s The Word – Infographic

How Much Money You Save by Having a Mum (infographic)

Having a Mum can save you loads of money each year. She makes sure your clothes are tailored, food is cooked and room is clean. Check out our latest infographic to see how much money she’s saving you on different services. This infographic is brought to you by QuickQuid. Places To Submit InfoGraphics Read more »

Home Improvement In 10 Minutes Or Less

Home Improvement In 10 Minutes Or Less - Infographic

Home improvement can be a real headache – costly and time-consuming. Check out these home reno DIY ideas that can be completed in 10 minutes or less. It includes tips for people concerned with updating their home’s curb appeal, such as cleaning the windows and weeding the garden. It’s free and only takes a few minutes. Plus it will make a great first impression for […] Read more »

SaaS Cloud Email Management Solutions

SaaS Cloud Email Management Solutions - Infographic

The report, SaaS with a Face: User Satisfaction in Cloud-based E-mail Management, is based on research across 248 organizations using SaaS email management solutions. It finds that, whilst the SaaS model is driving real business benefits, the quality of vendor support often leaves much to be desired – and these failings strongly affect customer satisfaction. Infographic brought to us by Mimecast Email Management Company. Submit […] Read more »

5 Tallest Buildings In The World – Infographic

5 Tallest Buildings In The World - Infographic

Below you will find the 5 tallest buildings in the world. The most interesting thing about the buildings is that none of them are located in the western hemisphere. The tallest building in the world is the Burj Kalifa and is located in The United Arab Emirates at 2,716.5 feet. The size of this building is absolutely mind blowing and would make things like commercial […] Read more »

The Adoption of Inclusion Education in the United States

The Adoption of Inclusion Education in the United States - Infographic

Inclusion education has become a crucial part of classrooms across the United States, offering students with disabilities, as well as the gifted, an opportunity to join the classroom community and prepare for a successful and productive life. Inclusion education has evolved over time, and as this infographic will illustrate has become an integral part of our education system. The true evolution began in 1972 with […] Read more »

Managing the Risks of an Extended Workforce

Managing the Risks of an Extended Workforce - Infographic

The new norm in staffing is officially here. It’s the extended workforce and it makes up more than one-quarter of the total workforce population in today’s organizations—more than twice the percentage from 2005. Unfortunately, despite the rewards offered by this dynamic worker population, studies show that most organizations fail to adequately manage the accompanying risks. Consider that these workers typically have access to the same […] Read more »