The Trucker’s Guide to Fuel Efficiency

Fuel Efficiency Infographic

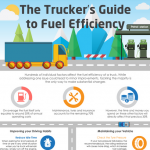
Poor driving habits account for more lost fuel than any hardware issue. While regular maintenance and upgrades can boost your vehicle’s performance, no amount of technical amendments will reduce fuel consumption as much as good driving habits. If you think that you’re using more fuel than you should, perhaps it’s time to slow down and focus on making changes. Simply reducing your speed and the […] Read more »

Types of Boats

Types of Boats Infographic

“I’m on a boat…” We all know that Lonely Island song by now. If not go check it out on YouTube. We all want a boat and I have heard that there are two good days with the boat, the day you buy it and the day you sell it. Below is all of the different types of boats you can buy. You can choose […] Read more »

Most Dangerous Areas in Louisville, KY for Pedestrians, Bikes, and Cars

Dangerous Areas for Accidents Infographic

Knowing the most dangerous areas in your hometown can save you some trouble and possibly help you avoid an accident. While the obvious benefits would be making you more aware of dangerous situations and keeping you safe, the less obvious would be helping you avoid streets that frequently are full of traffic due to various accidents. For Louisville, KY residents this infographic highlights the areas […] Read more »

History of British Train Travel

Train travel has come a long way since the 1800’s when it first originated in Salamanca. This infographic depicts exactly how much train travel has changed and where it’s at today. This includes the initial development of the first electrified suburban railway in 1904 to 1948 when British Rail was the biggest company in the world with 700,000 employees, to the development of the channel […] Read more »

Distracted Driving The New Epidemic

Distracted Driving The New Epidemic - Infographic

The car accident attorneys at Millar & Mixon, LLC offer a very informative infographic that provides details about driving distractions that can cause people to get into car accidents. Discover the most common driving distractions, how many people are doing them, age groups that are most distracted and laws against driving distractions per state. The law office of Millar & Mixon hopes that this infographic […] Read more »

10 Deadliest Counties For Illinois Drivers

10-Deadliest-Counties-for-Illinois-Drivers-Infographic

The Car Accident Lawyers at Salvi, Schostok & Pritchard P.C. compiled important data for this infographic about the most dangerous counties in Illinois for drivers. This infographic was put together from data found at the Illinois Department of Transportation and U.S. Census Bureau Illinois Quick Facts. This driver statistics infographic provides information about Illinois counties that had the most fatal car accidents recorded in 2010 […] Read more »

Dangers of Cycling In Cities

Dangers of Cycling in Chicago - Infographic

This infographic, prepared by Chicago bicycle accident lawyers, was designed to increase awareness of the dangers bicyclists face in large cities. It depicts the causes of bicycle accidents as well as the injuries typically sustained in an accident, gives statistics related to bicycling, and addresses the laws that must be followed by bicyclists. Courtesy of: Chicago Bicycle Injury Attorney Free Infographic Submissions Read more »

4 Biggest Myths About Truckers – Infographic

Trucker Myths Debunked - Infographic

  [Source: TruckertoTrucker.com Trucker Myths Debunked] Places To Submit InfoGraphics Here are the 4 major myths that people associate with trucks and truck drivers: Myth #1 Truckers are dangerous drivers and cause most accidents According to statistics, trucks are 3 times less likely to be in an accident than a regular automobile. Trucks are 4 times more likely to pass safety inspections compared to regular […] Read more »

Go Green When Moving By Reusing, Reducing, And Recycling

Move Carbon Footprint Go Green By Recycling

The average American will end up moving 11 times in his or her lifetime. This is data from the U.S. Census, and the moves could be from a new adventure, getting married, or a new job. Each time someone moves, it has a negative effect on the environment. Fortunately, the damage you do depends on the distance you travel when moving. We learn from this […] Read more »