How to Burn Off Your Rugby World Cup Grub

Rugby Food Infographic

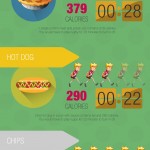
To celebrate the start of the 2015 Rugby World Cup, Citybase Apartments have created this new infographic looking at all our favorite rugby food and how much rugby you would have to play to burn all those calories off. From rugby stadium essentials like pie and pints to a quick energy fix chocolate bar, you’ll be surprised at the results! Read more »

How to Work Off Your Favorite Wimbledon Treats

Wimbledon Foods infographics

Ever wondered why you can’t get a tennis court in the UK during and after Wimbledon? It might have something to do with all of the special treats you indulge in during the tournament. Nothing goes together like Wimbledon and Strawberries & Cream right? Would you still indulge if you knew it would take you 53 minutes of non-stop tennis playing to work it off?  Find […] Read more »

NBA All Star Game Stats and Facts

NBA All Star Game Infographic

The NBA All Star Game is less than a week away, scheduled to kick it into high gear on February 15. If you need a crash course on who’s in, game stats and history, this infographic has you covered. Here you can find roster information, fun facts and stats of previous winners. Powered by www.BetOnSports.com. Read more »

Technology in Sport – Cheating or Progress?

Sports Technology Infographic

Technology is an essential part of sport, and technological development is inevitable. But where do we draw the line? Athletes routinely use technology to optimize technique and sports apparel, and equipment is constantly re-engineered to enhance and optimize performance. The question is, who is responsible for success – the athlete or the technology? Swimshop.co.uk have produced an infographic dealing with this very question. We must […] Read more »

The Cheltenham Gold Cup

Cheltenham Gold Cup Infographic

The Cheltenham Festival is the most popular horse racing event in the world. The festival is part of the National Hunt racing calendar in the United Kingdom, with prize money second only to the Grand National. It is an event where many of the best British and Irish trained horses race to an extent which is relatively rare during the rest of the season. Large amounts […] Read more »

The Super Bowl Tough Luck Teams

Super Bowl Losers Infographic

What’s more fun than talking about those juggernauts of the gridiron, those Super Bowl regulars who always seem to make it to the big show (I’m looking at you Pats.)? Talking about the losers, of course! Who know those unlucky teams who have never been, or worse, have been to the Bowl only to be defeated time and time again. Enjoy this infographic put together […] Read more »

How Alpinestars Made its Mark on Race Tracks Worldwide

Motorbike Clothing Infographic

Alpinestars have become one of the most well-known brands in the world of motorbikes. This is thanks to the international success and acclaim of riders wearing their racesuits. From Troy Corser’s podium finish at Imola to secure the 2005 World Superbike Championship, to Marc Marquez winning the 2012 Moto2 race at Valencia despite starting 33rd on the grid, some of the greatest moments in motorcycle […] Read more »

Which Country Should You Root for in the World Cup?

2014 World Cup

The 2014 FIFA World Cup is upon us and it’s hard to believe that it’s almost over. Let’s be real, the team you rooted for probably lost and now you’re stuck watching the World Cup without a team to cheer on. Or maybe your team is still in the race and you’re just looking for another team to root for just in case. Whatever the […] Read more »

Tour de France Stats and Facts

Tour de France Facts Infographic

With the 2014 Tour de France just around the corner, Eureka Cycle Sports have put together some interesting and fun facts from past tours, Including winners by nationality and the total number of winning cyclists from each country. France is currently in the lead with a total of 36 wins. The past 10 winners and their winning tour bikes have also been listed, including 2013 winner […] Read more »