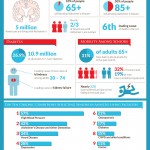
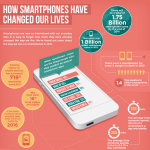
Game of Thrones: Why Did They Have to Die?

Game of Thrones Infographic

The HBO TV series Game of Thrones has shown no mercy when it comes to not only killing off your favorite characters, but also its biggest stars. Whether you love them or just love to hate them, they are no more. So why did they have to die? As Cersei once said, “When you play the game of thrones, you win or you die…” Check […] Read more »

What You Need to Know About the 2014 FIFA World Cup

2014 World Cup Infographic

Did you know that the 2014 FIFA World Cup is projected to be the costliest World Cup in history? Estimated costs show Brazil will spend approximately 3.5 billion dollars on the construction of the various stadiums and any related infrastructures. Not money spent without motive as Brazil is one of the favorites slated to win. The 2010 FIFA World Cup champions was Spain, which was a first […] Read more »

Aging Gracefully With Quality Care

Senior Health Care Infographic

This infographic shares informative data to illustrate that humans are living longer lives. A high level of senior care is necessary during our senior years to make aging a graceful process. Learn about diseases to be aware of as well as daily activities that can become difficult to handle independently as we age. Avamere Family of Companies offers many levels of senior care services, both […] Read more »

Buying Vs. Renting: Where Should You Invest?

Real Estate Investments Infographic

When it comes to property investments, this infographic breaks down a list of the top 30 communities in the nation based on rental yield percentage and rental share of income. Also included are the top 30 metro areas, listed by median house value, median monthly rent, median household income, rental yield percentage, and rental share of income. That’s a lot of great information! We even see, […] Read more »

Protecting Yourself From the Sun

Sun Protection Infographic

There has been a large increase in skin cancers over the last 20 years. It’s now the most common form of cancer in the United States, affecting over two million people every year. This has prompted many people to take skin protection much more seriously. Around 90% of all non-melanoma skin cancers have been linked to excessive exposure to the suns ultraviolet (UV) radiation so […] Read more »

Car Accident Statistics in Pennsylvania

Pennsylvania Car Crashes Infographic

We believe that knowledge is power. Armed with the knowledge of how and why accidents may occur in Pennsylvania motorists and citizens will know how to make better choices and hold their government accountable. The law firm Solnick & Levin has visualized data from the PA Department of Transportation into a handy infographic. They are hoping to get more visibility to review the data and […] Read more »

Addiction Treatment in Alabama

Alabama Addiction Treatment Infographic

Looking for general information on treatment centers and facilities in the state of Alabama? Explore this infographic designed extensive research to provide the best and most relevant statistics on this matter. Did you know 147 treatment facilities are open and functioning in Alabama? Did you know around 16.000 patients in Alabama receive treatment at any point in time? Did you know 93% of Alabama’s medical treatment centers […] Read more »

Franchising Disputes in Australia

Franchise Disputes Infographic

In Australia, the franchising industry is rising rapidly. Over 400,000 people are employed in franchises and 90% of these franchises are operating profitably. Currently, the top 3 franchise industries are retail and trade, accommodation/food services and admin/support services. The below infographic demonstrates the increase in demand for franchises and the types of industries these franchises are found in. It also delves into the most common […] Read more »